
Don't miss leadership insights
Leadership data is only useful if it can be understood. Most reports stop at scores, leaving leaders to interpret what those numbers actually mean. The Reporting Engine in Lumolead is designed to go further by turning raw assessment data into structured, explainable, and actionable insight.
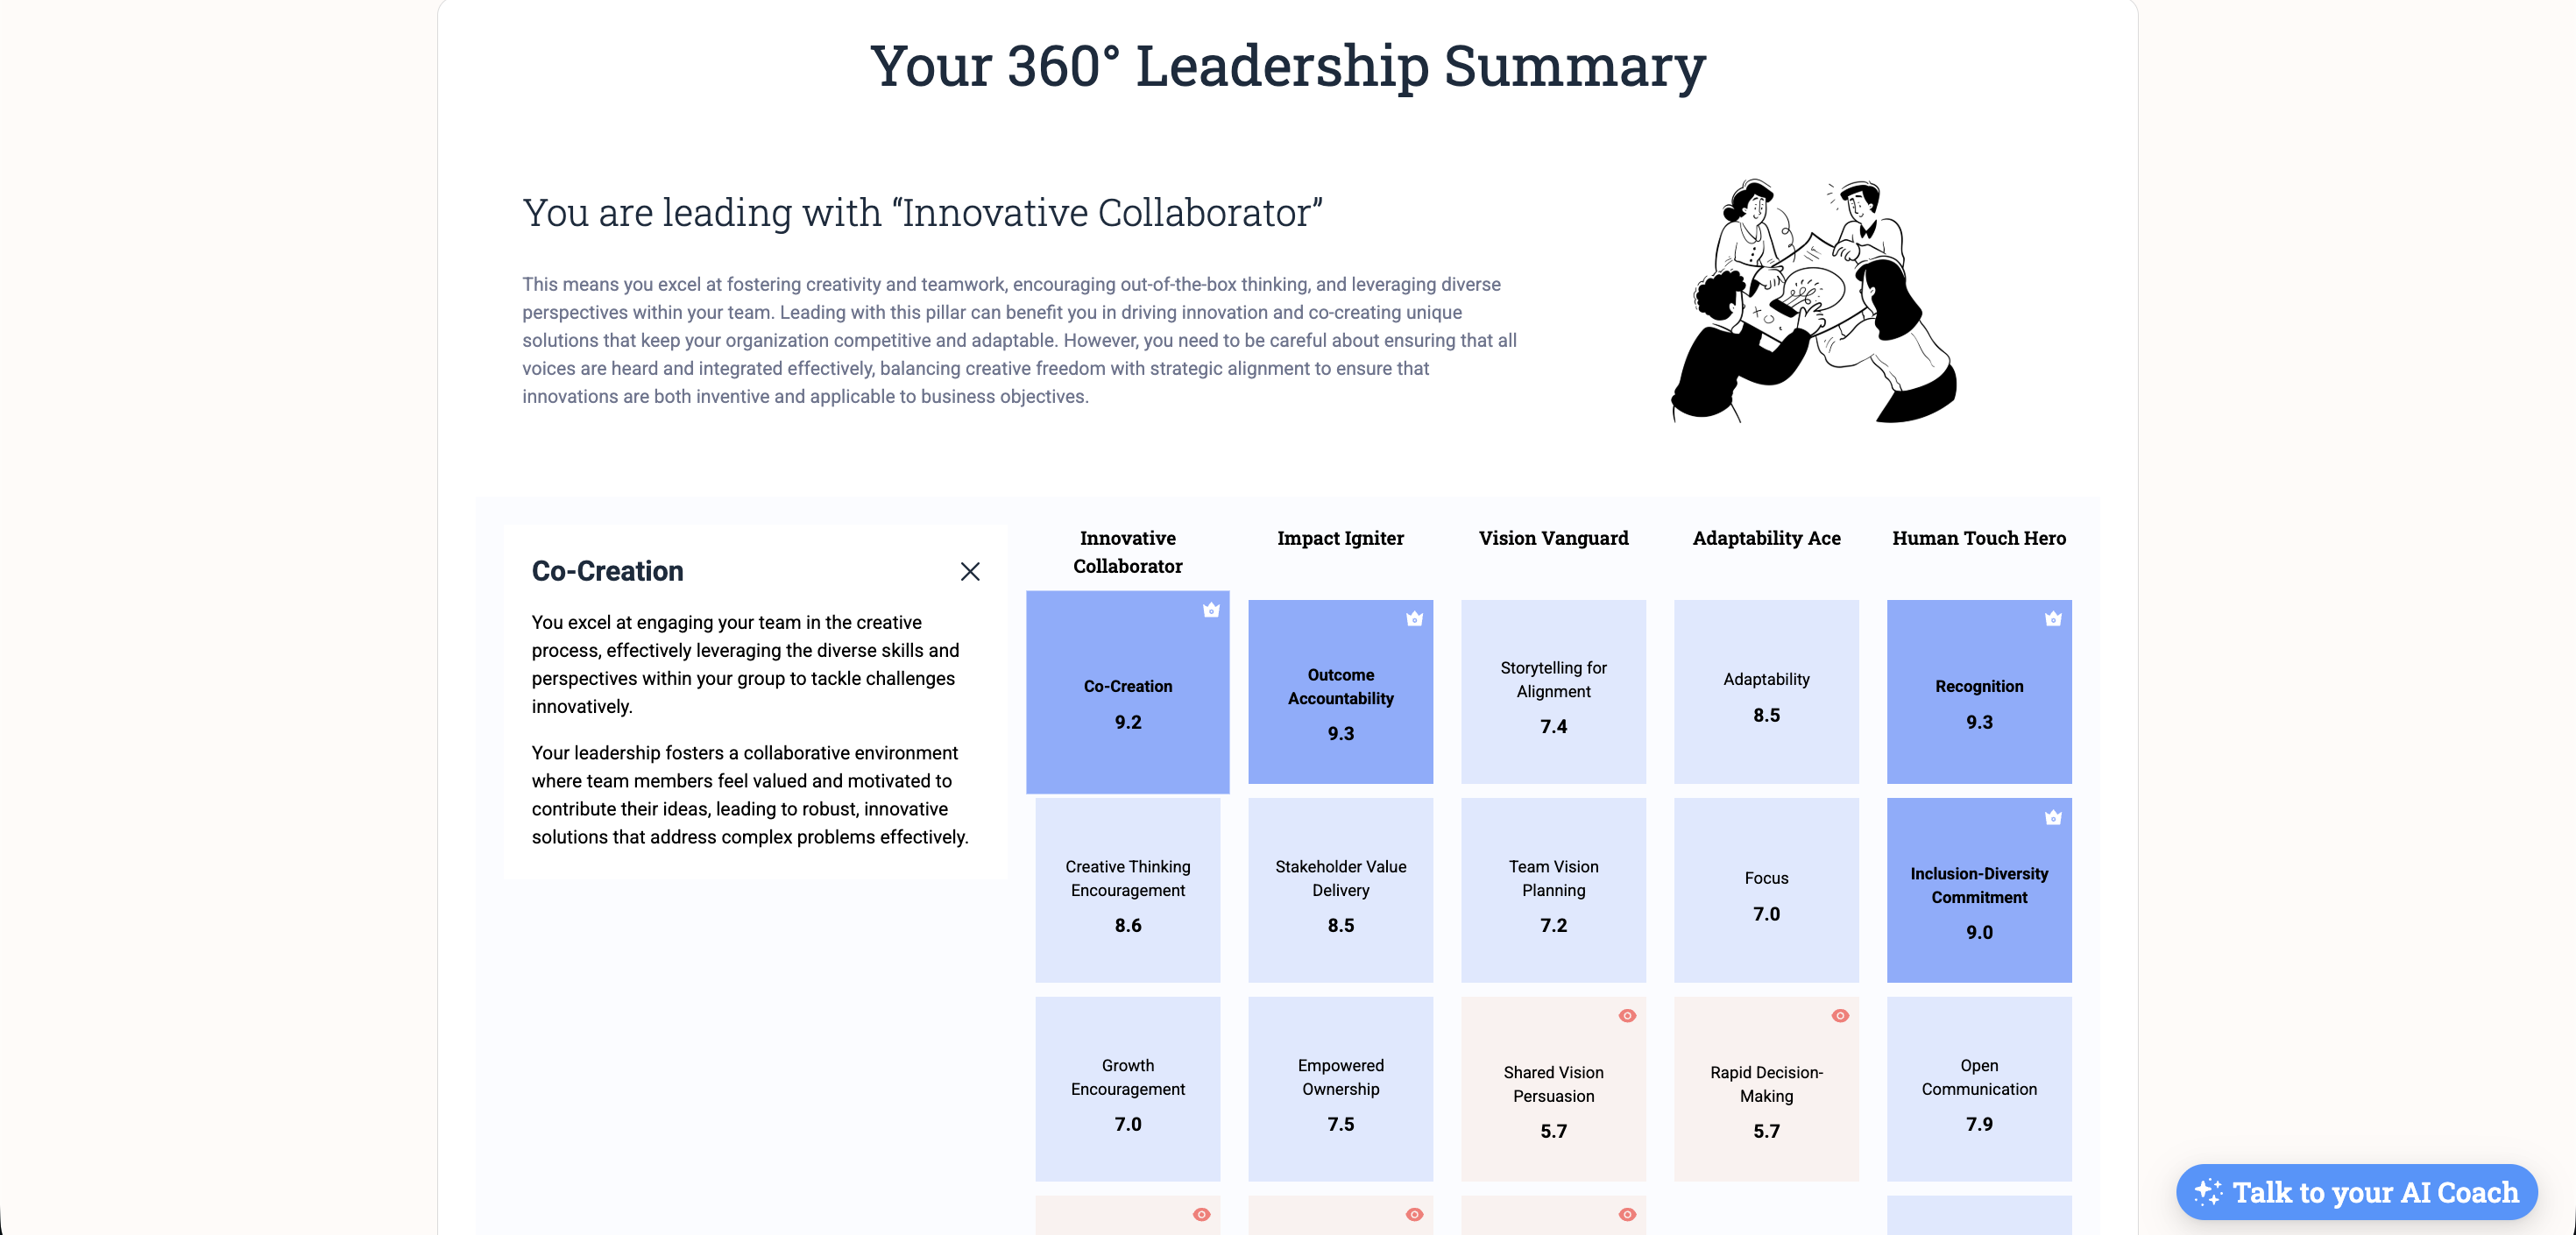
Each report translates assessment results into a clear structure of 23 leadership skills grouped under 5 core pillars. Instead of isolated numbers, leaders see how their capabilities connect, where they are strong, and where attention is needed. Scores are calculated using a weighted system that combines self, team, manager, and other perspectives, creating a balanced view of leadership in practice rather than a single opinion.
This is how leadership data is organized inside the report.
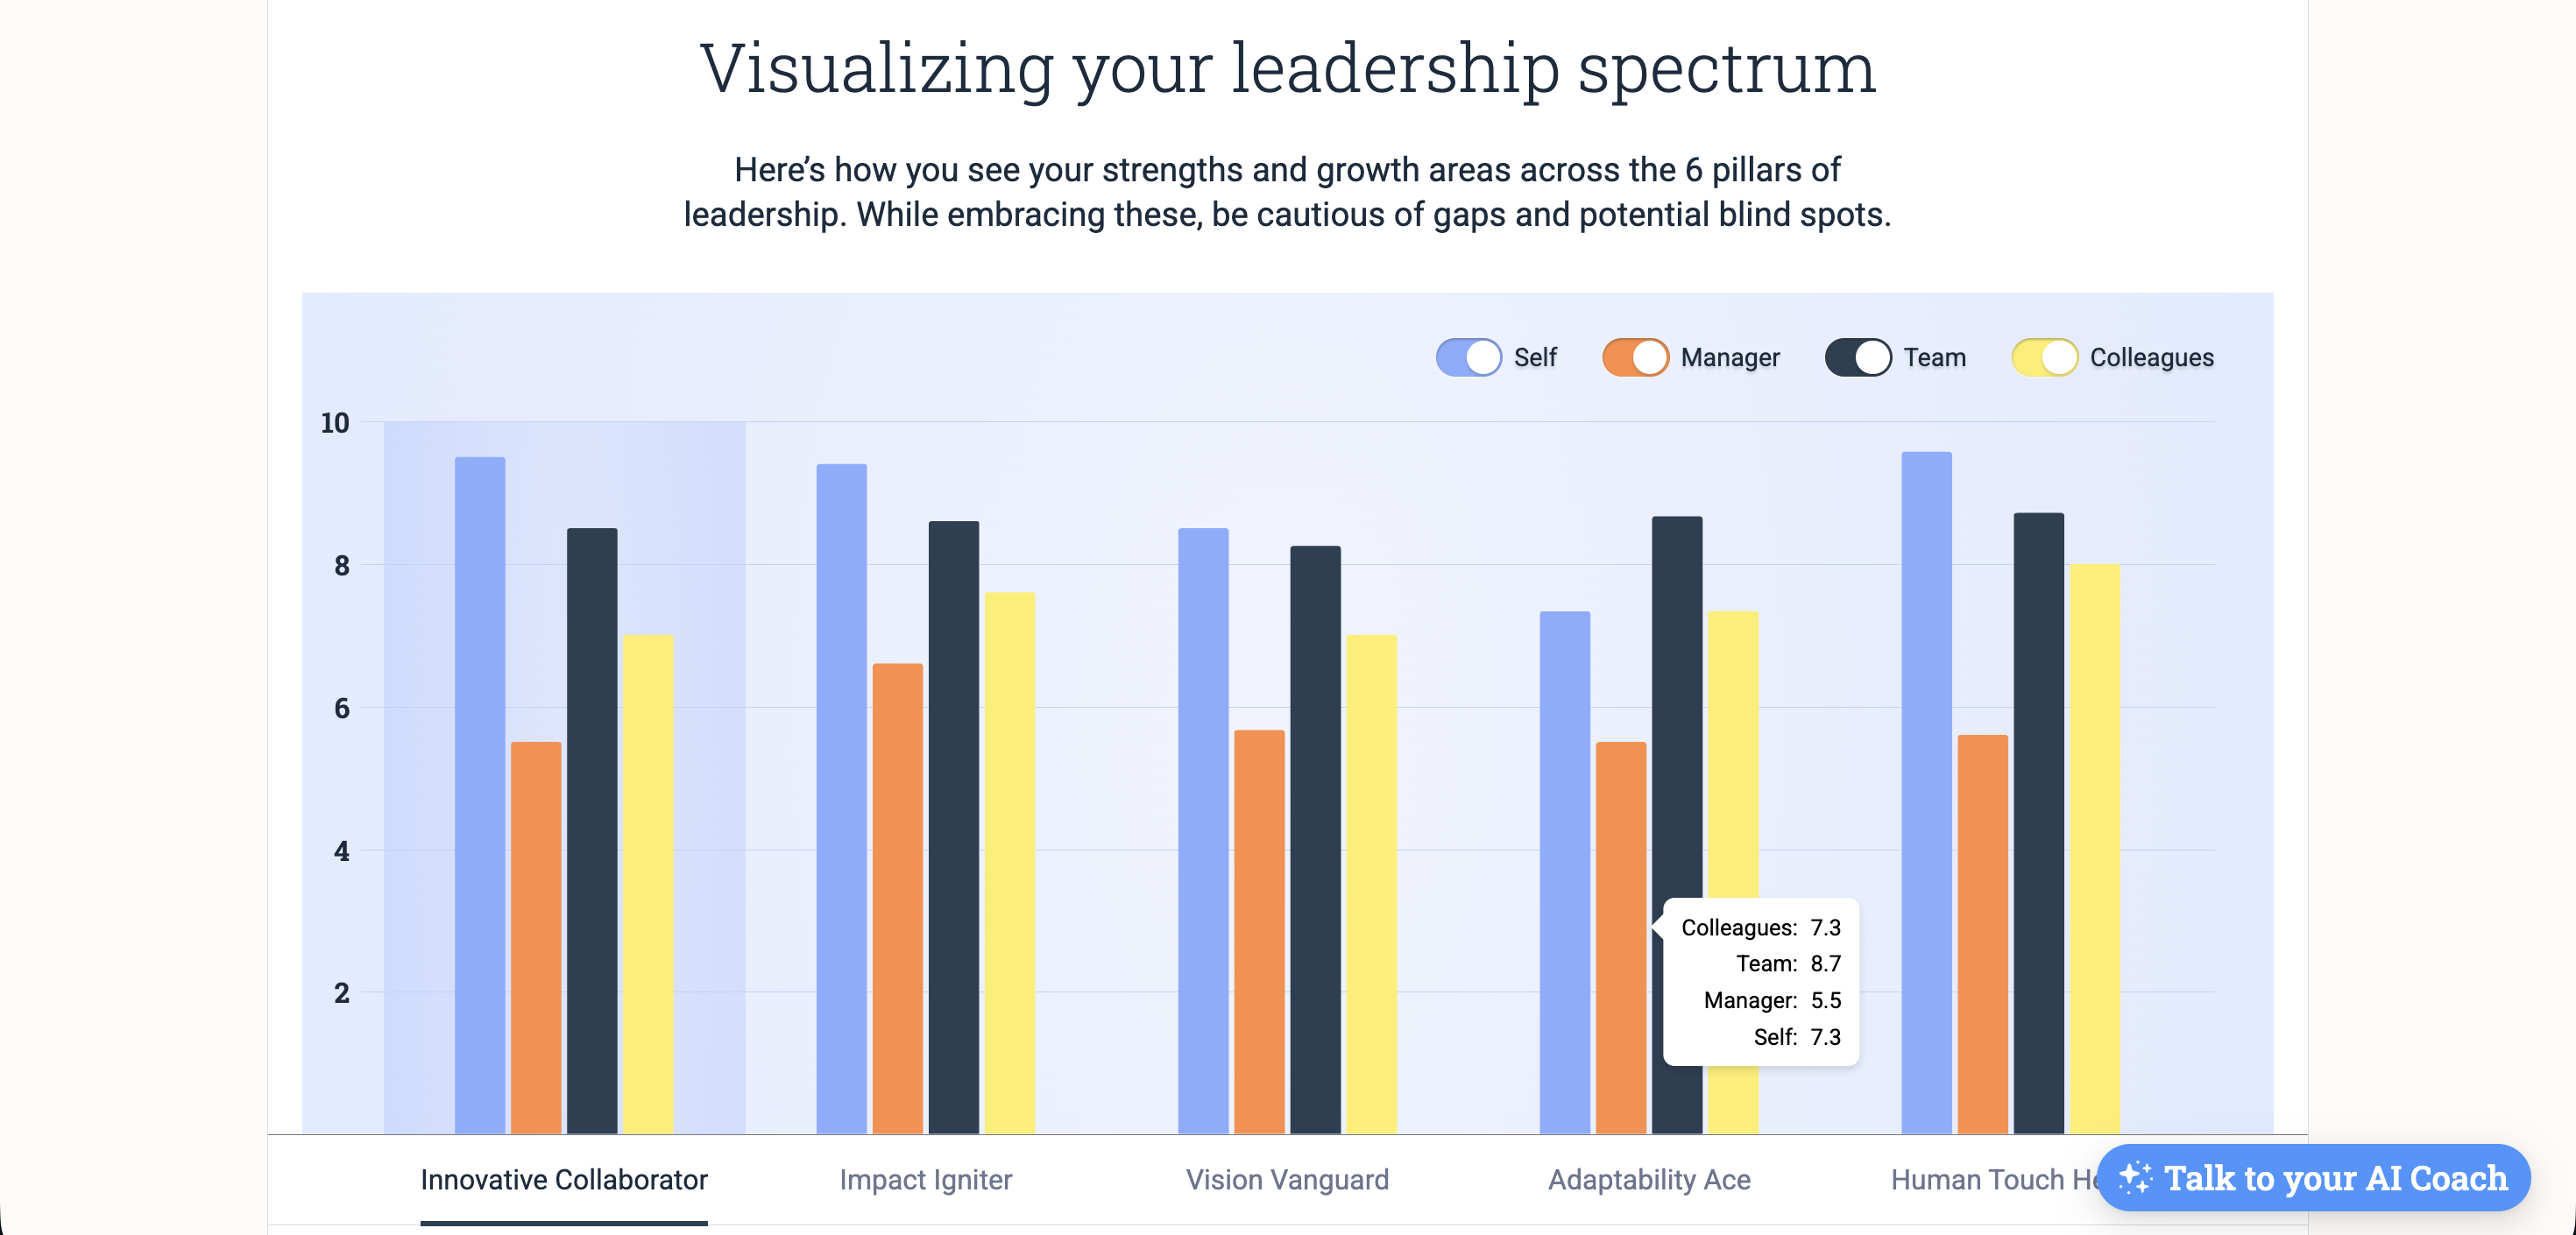
Reports bring all perspectives into one place. Leaders can compare how they see themselves with how others experience them through simple visualizations, making alignment visible while also revealing where perceptions start to diverge. When this difference becomes meaningful, it is highlighted as a gap. If self-perception is higher, it may indicate overestimation. If others rate higher, it may reveal underused strengths. These insights are built directly on the leader’s data and explained in context, turning comparison into clear direction.
This is how different perspectives and gaps appear side by side:
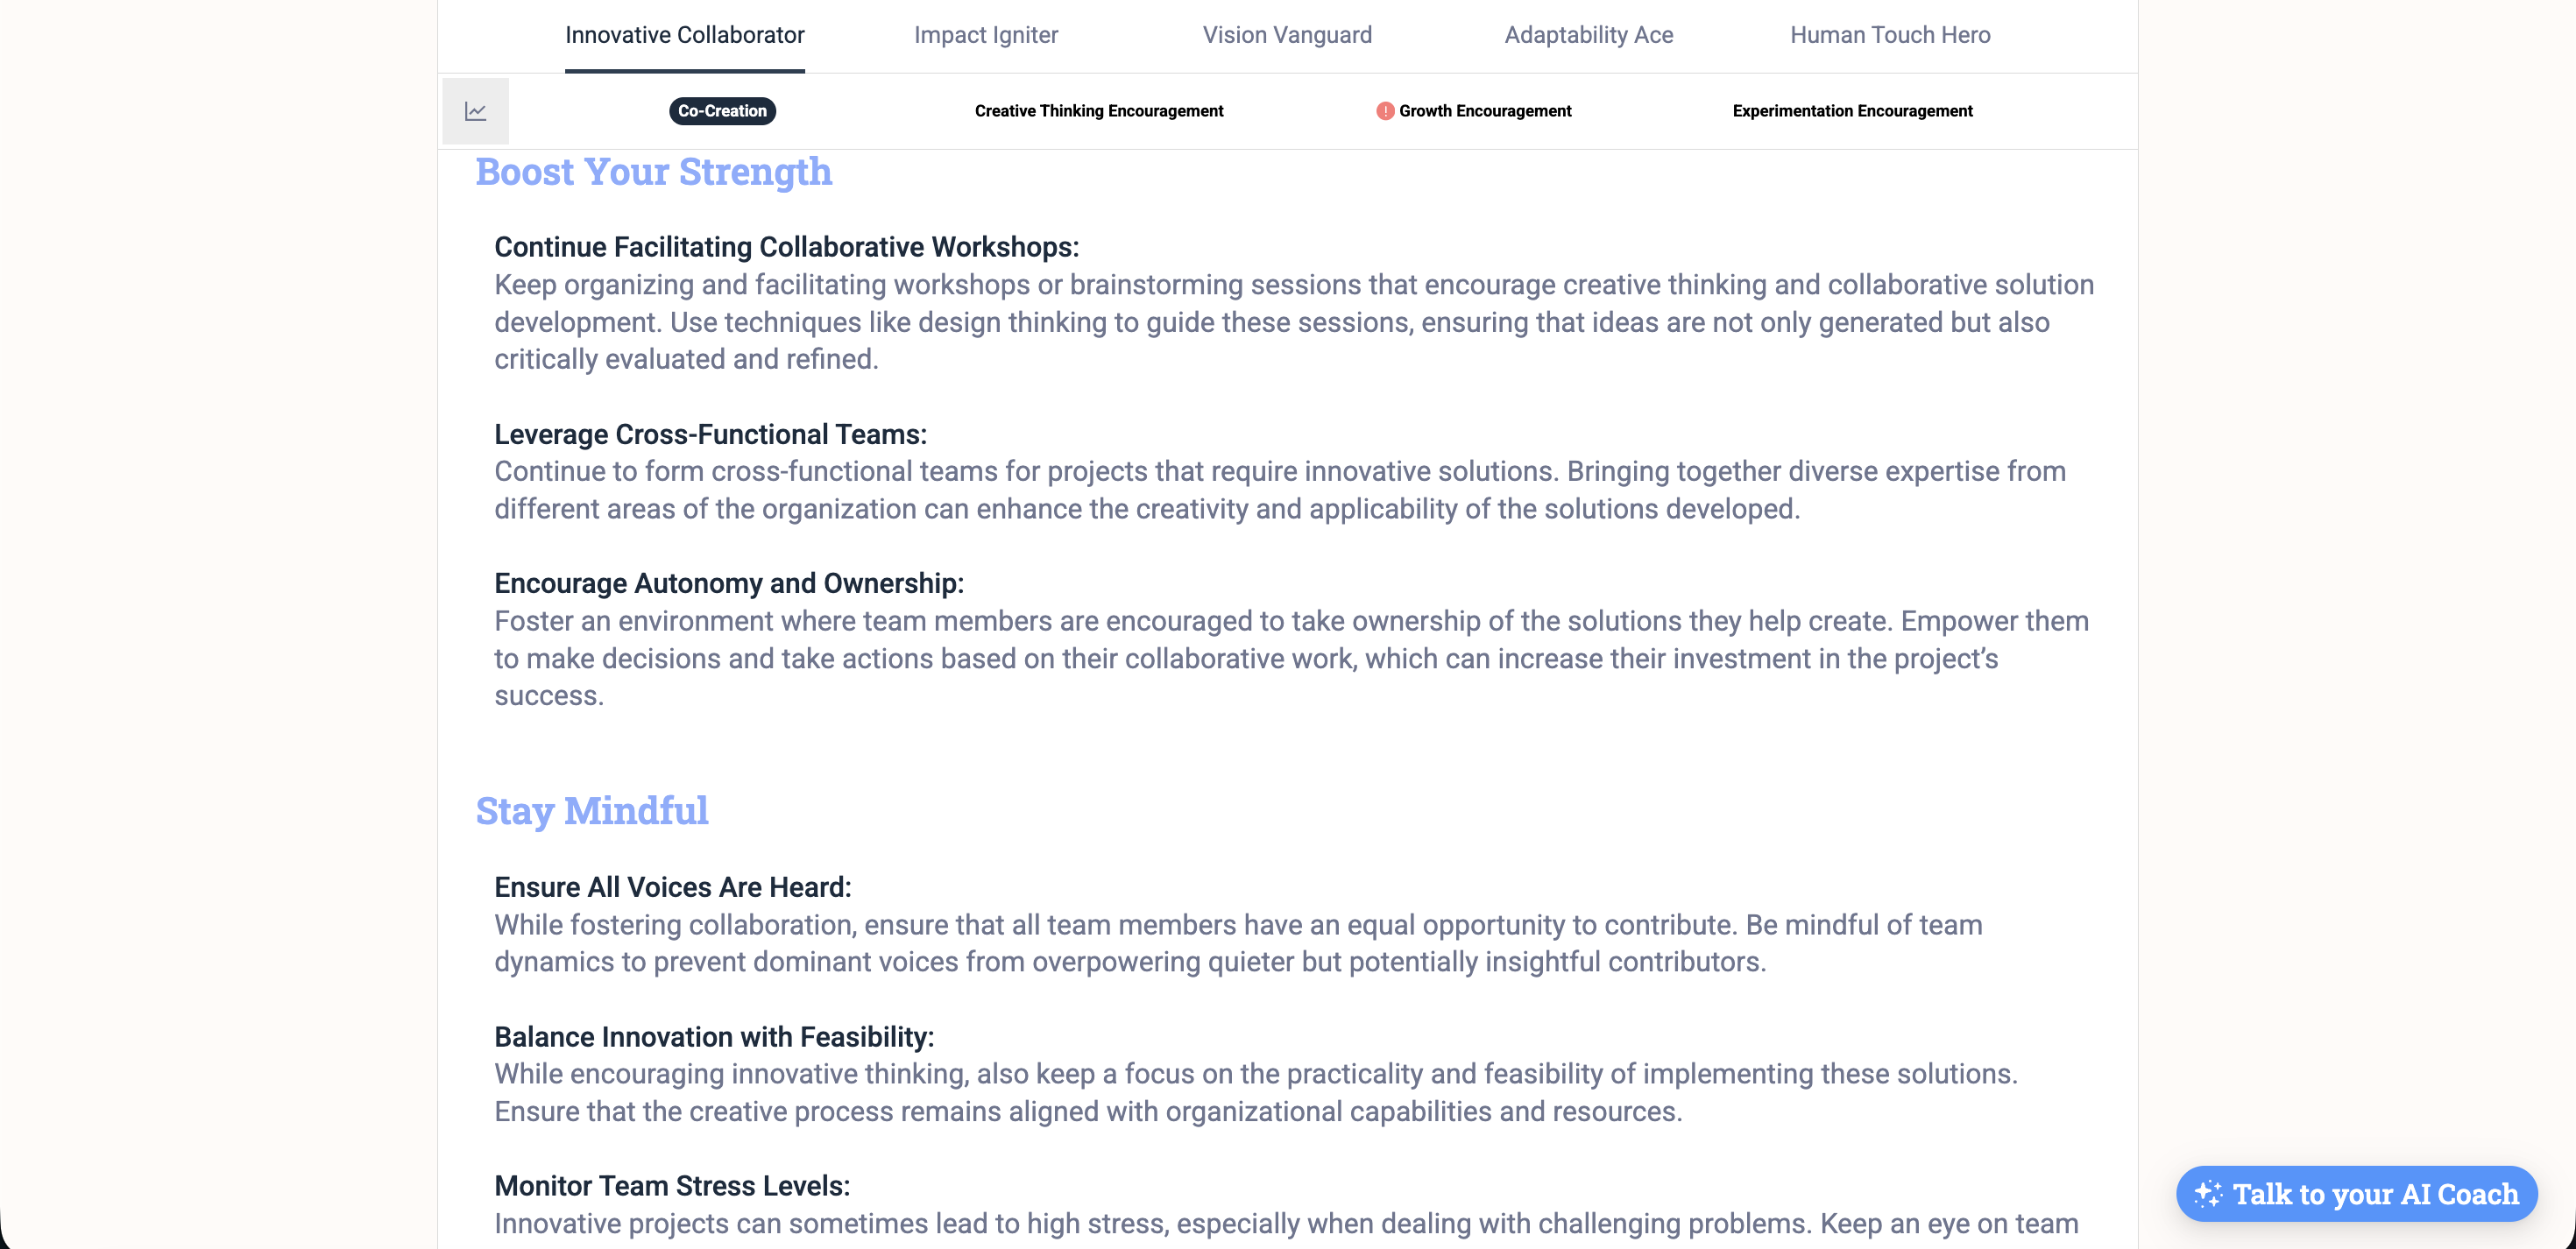
Very high scores are not always simple strengths. When a skill crosses a certain threshold, it can become a blind spot, something that is overused or affecting other areas. The report flags these cases and explains what that might mean in real leadership situations. At the same time, each skill includes clear explanations of what the score indicates and how it shows up in daily work, along with specific action suggestions. This helps leaders move from awareness to focus, supported by both detailed insights and higher-level pillar summaries that guide where to act first.
Leadership effectiveness is not only about skills. The report also includes a dedicated self-care view, with an energy level indicator that helps leaders understand sustainability and performance together. This adds another layer of awareness that is often missing from traditional reports.
Here’s how energy and self-care appear in the report.

Reports should not be static summaries. They should help leaders understand, reflect, and decide what to do next. By combining structured scoring, multiple perspectives, and contextual explanations, Lumolead turns reporting into something leaders can actually use.
If you want to explore how a real leadership report looks in practice, we can walk through it together.

Boost your goals with bonus insights! See more content on LumoLabs.
.png)